Elaine and James Hansen

Elaine and James Hansen
CLICK HERE for My WEBSITE

Thursday, December 12, 2013

Is it Good News or Bad News?

CoreLogic posted their October National Statistics

Nevada Leads the Nation with 26% Equity Growth over the past year.

This has many people shouting, "Bubble!"

Look a little further down and it also shows that Nevada has the largest margin 
from our Peak Values back in 2007.

In an attempt to put this growth into perspective,
look at the Trulia Median Sales Price Graph below.


It looks to me like we are finally making some positive progress.
But people are so use to Negative News, that's what they expect.


Wednesday, November 13, 2013

Home Values Have Gone Up... So What's My Home Worth?

 The Most common Question we get is,
"How's the Market?"

Depends, Are you thinking about Buying or Selling
If you're Buying, I would say the Market is Good.
If you're Selling, I would say Great!

Home Prices have continued to Rise over the past 12 months.
Peeking in August and still holding strong.
Market Activity continues to Rise as well,
even with Investors "Backing Off".

Concerns of a second Housing Bubble and Rising Interest Rates 
have many people sitting on the fence to see how it all plays out.
In my opinion, other than the normal ebbs and flows,
Home Prices won't ever be as low as they were at the beginning of this year.


The Next most common Question we get is,
"What's My Home Worth?"

If you're Curious, 
We have Invested in an Over-the-Internet Home Evaluation Tool.
As Seen Below.


Data and Graphs courtesy of:

Friday, November 1, 2013

Inventory is on the Rise... Is that Good or Bad?


You have probably heard on TV or Radio have our Inventory has been Rising.
But Exactly How Much and Why?

In the Graph directly below, the Orange dotted Line represents that Months Inventory.
The Blue Bars below represent the Number of Months of Inventory, at the current Rate of Absorption.
The Rate of Absorption is the number of Sales that month.
For example... We have close to 7,000 Homes on the Market and we Sell about 3,500 a Month,
meaning we have 2 Months worth of Inventory.

According to the Experts ( people who's opinion is supposed to mean something ),
A Healthy Real Estate Market should have around 3 months of Inventory.
Less than 3 is considered a Sellers Market.
More than 3 is considered a Buyers Market.

We have also heard about all the Shadow Inventory of Foreclosures 
that are supposed to be being dumped on our Market.
There are 637 REO's of the 8,728 Listings or 7.2% Bank Owned
FYI... Short Sales make 14.6 % of the Active Listings.

In my opinion...
The reason Inventory is Rising is that Prices have gone up. (see Graph 2)
(1) Investors are backing out of Las Vegas because their Margins are shrinking.
(2) People finally have Equity in their Homes and want to Cash-In.
(3) The Timing.  Real Estate is cyclical. The Summer Price Surge has Sellers trying to Cash-In.
The Fall Drop Off means that people are not buying as Fast as they were just a couple of months ago.

People are concerned that there will be another a Housing Bubble / Burst.
We all still have a Bad Taste in our mouths from the last one,
and the Media loves to grab our attention with bad news.

Looking at 2 graphs below, I don't see anything to give me cause for concern.


Wednesday, October 23, 2013

A Knee Jerk Reaction... But Wait, Let's Think About it!

As Realtors, we get sent all kinds of emails from 
Lenders, Title Companies and others in the business sharing information they have access to
 to help educate us about what is happening in the Las Vegas Real Estate Market.

 Below is a graph we received this week with a note saying,
"When I look at this I’m thinking that we will be seeing short sales and REO’s in our future."
 

At first look, I see that Notice of Defaults (NOD's) are way up for September.
But why were they so low in June and July?
Well, on June 3, Nevada passed the Home Owner's Bill of Rights.
It's my opinion that this is why NOD's dropped when they did.
The Banks wanted to have their Lawyer's pick apart the New Law.

Second, is that 3,677 number really that high?
From Jan - May we averaged about 1,500 a month.
If you add June - Sept numbers, and divide by 4.
99 + 487 + 1,114 + 3,677 = 5,377 / 4 = 1,344
Which is below average for this year.

But this graph got people talking.  It grabbed a few headlines.
The Local News and Radio warned we could see more foreclosures.
Really?   Based on a Knee Jerk Reaction!

Wednesday, October 9, 2013

Front Page News... Did it get your attention? Should it?

On Tuesday, the Las Vegas Review Journal had this on their front page.


After 19 consecutive months of increases, we had 1 month with a 1% drop in the Median price.
 Should we prepare ourselves for the next Crash?
Should Home Owners Sell Now?
What does it Really mean? 

First of all, the Median Price means the middle.
Not the Average.
This is not a trend.

If you look close at the graph on the right, you can see the trends.
And within the trend you can see little up and down movements.
So unless we see this same graph in three months and it continues downward,
 I don't think we have much to worry about.

The next question I would ask is why did it go down?

If you think back we posted a previous blog about how Interest Rates had gone up a full 1 %
and how that would affect Buyers and how much they qualified for.

Maybe it's something as easy as people were focusing on getting the kids ready for school. 

Property Values have been on the rise for over a year and a half.
And more recently they have been rising rapidly.
I think Buyers are taking a step back and saying, "Whoa, Not So Fast!"


Investors are slowly backing off of Las Vegas because as Prices go up, 
and if rents stay the same, then their profit margins go down.

This is all to be expected in a normal Real Estate Market.
The market, when not being manipulated, self adjust.

Before we all get in a panic, let's just wait and see what happens.

Thursday, September 26, 2013

Market Numbers, Statistics and Trends

As of Today Thursday September 26
 
There are 7,879 Available Listings
 
of them 1,032 are Short Sales (13%)
504 are Bank Owned REO (7%)
leaving 6,343 Traditional Sales (80%)
3,584 of All Active Listings are Vacant (45%)
(Traditional Sales Include Investors Selling Rentals, Investor Flips and Regular Sales)
 
There are 10,004 Listings Under Contract 
 
of them 6,491 are Short Sales (65%)
358 are Bank Owned REO (3.5%)
leaving 3,155 Traditional Sales (31.5%)
3,755 of these Listings are Vacant (37%)
Also, 5,711 of these are expected to be CASH transactions (57%)
(keep in mind that Short Sales take an average of 6 months to Close)
 
Over the past 12 months there have been 40,429 Sold Homes
 
of them 14,315 were Short Sales (35.5%)
3,941 were Bank Owned REO (10%)
leaving 22,173 Traditional Sales (54.5%)
20,374 of the Sold Listings were Vacant (50%)
Also, 22,259 of those Sales were CASH transactions (55%)
 
The Previous Years had a total of 45,161 Sold Homes
 
of them 14,374 were Short Sales (31.8%)
16,321 were Bank Owned REO (36%)
leaving 14,466 Traditional Sales (32%)
31,547 of the Sold Listings were Vacant (70%)
 Also, 23,682 of those Sales were CASH transactions (52%)
 
In the past 30 Days, there have been 3,256 Sales, 1,559 were CASH (47%)
(CASH Buyers tend to be Investors)
 
So what does it all mean?
We can see some Trends.
 
The market has had fewer Bank Owned Foreclosures (REO)
 
Fewer Short Sales are being Listed.
Probably because Home Owners have Equity again 
and are Selling as Traditional Sellers.

Fewer Cash Buyers (Investors) are Buying Homes.
Prices have gone up, Rents have stayed the same,
making it harder for investors to get the return they need.
 
People are very skeptical about what is going to happen 
with the Las Vegas Real Estate market.
 
Are we at the beginning of another Bubble and potential Burst?
 
Or will the market . . . 

Thursday, September 19, 2013

AB 300 vs NV Homeowner's Bill of Rights...

 
Back in June we talked about what affect Assembly Bill 300 would have on our local Real Estate Market.
We have all heard about the increasing number of homes out there just sitting vacant.
Would the banks flood the Market with these listings or would they trickle on the market.
Last week the LVRJ had an article,
 Notice of Defaults went up from 340 in June to 1,125 in July a 226% jump.
In the big scheme of things, really not that big of a deal. 
We knew they were coming. 
But what is next?

Well, in the meantime, NV has passed the NV Homeowner's Bill of Rights.
What's that?  Good Question.
In my opinion, a couple of years too late. 

Purpose of the Nevada Homeowner’s Bill of Rights
The purpose of the Homeowner’s Bill of Rights is to provide homeowners in the state of Nevada with better consumer protections, as well as fair and honest treatment in the servicing of mortgage loans in default, especially when it comes to the loss mitigation process.


Many are speculating that the Intentions of AB300 was to allow the banks to Foreclose on the Shadow Inventory, but now the NV B of R's is going to draw that process out even longer.

NV Homeowner's Bill of Rights takes affect Oct 1st.
In the meantime, we will probably see the banks rush to Foreclose on as many properties as they can 
before the new Law takes affect and slows the whole process down again.


Friday, September 6, 2013

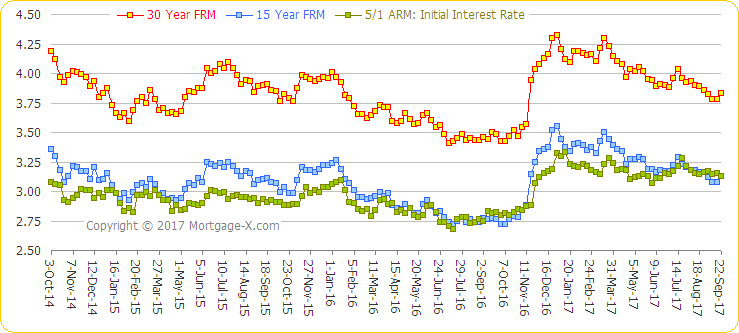
Interest Rates are on the Rise... What affect does that have?

When Calculating your Monthly Mortgage Payment, 
there are two primary numbers to look at.
The Cost of the Home, and the Mortgage Interest Rate.

Using an Example of a 30 year loan, Calculating only Payment and Interest.
(but do not forget about Taxes, Insurance, Association Fees and MIP)

If you Financed a $250,000 Home Loan in May 2013,
when Interest Rates were at 3.5
Your monthly Payment would have been $1,122.61

Purchase the same home today at the same price,
with Interest Rates at 4.5
Your monthly Payment will be $1,266.71


That's a difference of $144.10 per month


Reproduced with the permission of Mortgage-X.com

 So in a Market when Prices and Interest Rates are going up.
People want to Buy Now before Rate or Prices get any Higher.


Tuesday, August 27, 2013

Compare Las Vegas Price Trends to other National Markets

We have watched how this Price Trend has Steadily Risen through the Summer.
Now it's starting to climb even faster.

The question is, Why?
Why is it climbing so fast?

My Opinion ...
People believe that we hit the bottom and prices will never be this low again.
Investors are grabbing everything and anything they can get.
Interest Rates have been trending up.
The combination of all of this is resulting in Prices Going UP!

Home Price Index report from Lender Processing Services (LPS) 

I find this very interesting.
Skip the numbers and check out the miniature graphs on the left
and compare them to the graph of Las Vegas up top.
AZ and CA are very similar to Las Vegas.
Texas and Colorado don't even look like they ever had a
 Recession, Depression, Bubble or anything.
Also notice that in every major market shown above,
they are All Trending Upward.


Tuesday, July 16, 2013

National Real Estate Market has Affect on Las Vegas

Las Vegas, more so than probably any other city in the US,
is directly affected by the National Economy.

As a Vacation destination, the better the rest of the country does, the better we will do.


People across the country are buying houses again because
Housing is considered to be more affordable than in the past.
Cash Buyers are more confident that if they put their money in a Home,
it wont lose its value like it has over the past several years.

When people buy homes, they usually put money into them.
New appliances, paint and carpet.
This spurs the economy.


Home owners seeing home values rise again are more likely to
"buckle down" and make that mortgage payment.


Nationally thing seem to be moving in the right direction.
This should have a positive affect on Las Vegas and our Housing Market.

Monday, July 8, 2013

Just Listed in Downtown Historical District

Hello One and ALL,

Elaine and I recently took a New Listing we thought some of you might be interested in. 
The most Interesting and Unique feature of this house is its location.
It is located in the John S Park Historical District in Downtown Las Vegas.
It is walking distance to all the new development that has been happening in the area.

If you know anybody interested in previewing this home or any others in this upcoming area,
please give them our name and number, and have them give us a call.

This beautiful charming home is located in the heart of John S Park Historic District and is on over a quarter acre lot. It boasts a big open living area with wood burning fireplace and large bay window overlooking the lush front yard. Den could be 3rd bedroom with a full wall of built-in shelves, drawers and cabinets.. The dining and family rooms look out on park like backyard with mature fruit trees, a lovely fountain and lots of room for the urban farmer in you. There is a detached one car garage that would make a great artist studio or workshop and an extra shed for storage. This home has been well cared for! Walking distance to First Fridays, Art District, The Outlets, Legal District, Zappo's and more!

 To view more pictures and details, please click the following link.


Wednesday, June 19, 2013

Nevada AB 300 - Will it solve the Shadow Inventory problem or cause a new one?


As of June 1, 2013 Nevada passed AB300 designed to solve some of the problems caused by AB284.
AB284 was designed to set up rules for the banks to follow when foreclosing on a property. If you remember the robo-signing scandal where banks were illegally foreclosing on properties without all the proper documentation.  They were afraid that would lead to crazy law suits were a family thinking they purchased a house in good standing to then be kicked out so the original owner could have it back.
A huge potential legal and social mess.
The bad part of AB284 is that banks were afraid to foreclose on these homes because they could face large fines and legal fees. So they didn't. In the short run it had a positive affect on the market, low supply and increasing demand led to increasing prices.  Now it's being viewed as the reason you look around your neighborhood and there's that house that has been sitting vacant for a couple of years now.
This is what they referred to as the "Shadow Inventory".
AB300 is now trying to set up new guidelines for the banks to follow to avoid all the issues previously stated. 

Many people are concerned that this is going to cause the banks to flood the market with this extra inventory and lead to another "crash".
I don't think so. The banks have never done anything at a fast pace. We would be lucky to see an extra 1,000 a month released on the market. With the current demand, that would have almost no affect.

In my opinion, I think people have become cynical.  Over the past 6 years we have had so much bad news, and now people just expect more.  The worst is behind us.

Wednesday, June 5, 2013

Why are Prices Going Up So Fast?

Activity is staying the same, so why are prices on the rise?

In this Humble Realtors opinion, Buyers believe the worst is behind us.
They want to buy now at today's prices, before the properties become less affordable.
Sellers, if there going to sell, they want top dollar.
Inventory is low, Interest Rates are low, People want to Buy Now, Sellers want $

Prices Go Up!


Wednesday, May 29, 2013

S&P / Case-Shiller Home Price Indices - First Quarter 2013

This can be a confusing graph...

Keep in mind there is a 10-city line and a 20-city line.
Las Vegas is part of the 20-city composite.

Also, the graph is charting the percentage of change over the previous year.
You can see from 2005 to 2009 we had a huge swing from
15% in growth to a 17% decline.
For many home owners, depending on when they purchased,
that was over 50% of their homes value.

The good news is that many people are getting some of that equity back.

Tuesday, May 21, 2013

Las Vegas Homes Price Spike... #1 in Nation


Prices are racing upward again.
Does that mean we are blowing up another bubble?
We shall see. . .

You can see from previous Blog Posts and the graph below,
we are still way below what "True Values" should be.


Thursday, May 16, 2013

Las Vegas Homes Undervalued ? Maybe it's Time to Buy . . .

This is what Investors are seeing.
We are the #1 most Undervalued City in the Nation.
( according to Trulia )
Second only to Detroit, but who wants to live in Detroit?


Last Month, 59% of All Closed Transaction were CASH Buyers.

Wednesday, May 8, 2013

Las Vegas Home Prices Surging ...


Front page article in the LVRJ.

Median prices up 30.6 % ...
Median is very different than Average or Appreciation.
Median is the middle.  Average is the Total of all Sales divided by the Number of Sales.
So the middle is going up meaning people starting to buy more expensive Homes.

The article later goes on to say that Las Vegas Valley Homes
have Appreciated over 20% in the past year.
Still a very good sign.

A couple of other interesting points the article discusses are;

- This surge in Sales is also affecting local Repairman and Home Decorating and Home Fixture Sales.
- They claim that there is still a years worth of Inventory sitting vacant out there.
- Currently, 59% of All Sales are Cash transactions, which are usually Investors.
- The Builder are out of developable land,
and prices need to go up another 20% before building makes sense.

Monday, April 29, 2013

What's Causing this Surge of Activity in Las Vegas?

An article containing the above graph from RealtyTraq.com is all over the internet.
I found it reposted on The Wall Street Jornal Website. 
Investors around the Nation see statistics like this and want to get their money in play fast. 

Over the past month, we have taken 4 new listings. 
We marketed them and kept them active for 1 week to allow Buyers time to submit offers. 
We received on average  10 offers per listing.
Over half of those offers were Non-Owner Occupant All CASH offers Over List Price.

All this activity is Pushing Home Prices Upward at a fast pace.
Maybe a little too fast?!

Monday, April 15, 2013

Appreciation in 2012

Recently, the Las Vegas Review Journal and SalesTraq put out a Report showing the percentage of change in Home Values for all of Las Vegas Area Zip Codes.


This is a good sign that our local Real Estate Market is heading in the right direction.

Many home owners who wanted to sell but couldn't because they were upside down on their loan,
now have positive equity.

Friday, April 5, 2013

Las Vegas Market Activity - April 2013


We are once again on an Upward Trend.
Last Years Price Bubble was a little too much, too fast, and it Popped.
This years upward projection seems to be at a more sustainable pace.

Every Realtor I know is both Happy about the Upward Trend and Buyer Confidence,
and Frustrated there is not enough Inventory.

If you have been considering Selling, Now might be the right time.
If in the past you have been upside down on your home,
you may now have positive equity.


CoreLogic, a Leader in National Real Estate Statistics put this out this week.

The Interesting Stat for Las Vegas is that NV leads the Nation in Appreciation.


Thursday, January 24, 2013

Market Update Jan 2013

NV still leads the Nation in Homes being upside down.
Over 50% of All NV Home Owners have a Negative Equity.


The Price Bump we had last summer leveled itself out.
Now it appears we are trending upwards Again.

Are Prices on the way up? 

No matter what your thoughts are on the Election, the Economy or the  Future...
Buyers are Jumping into Real Estate right now.

Inventory is Low
Activity is High
We are seeing Multiple Offers on Any and All good looking Listings.

The only Question...
Will this Economy go in the right direction?